Main Street Capital’s 8.2% Dividend Yield Faces a Tighter Coverage Test
Main Street’s income is growing, but its projected 2027 dividend payout exceeds net investment income. The regular dividend and special payments tell different stories.
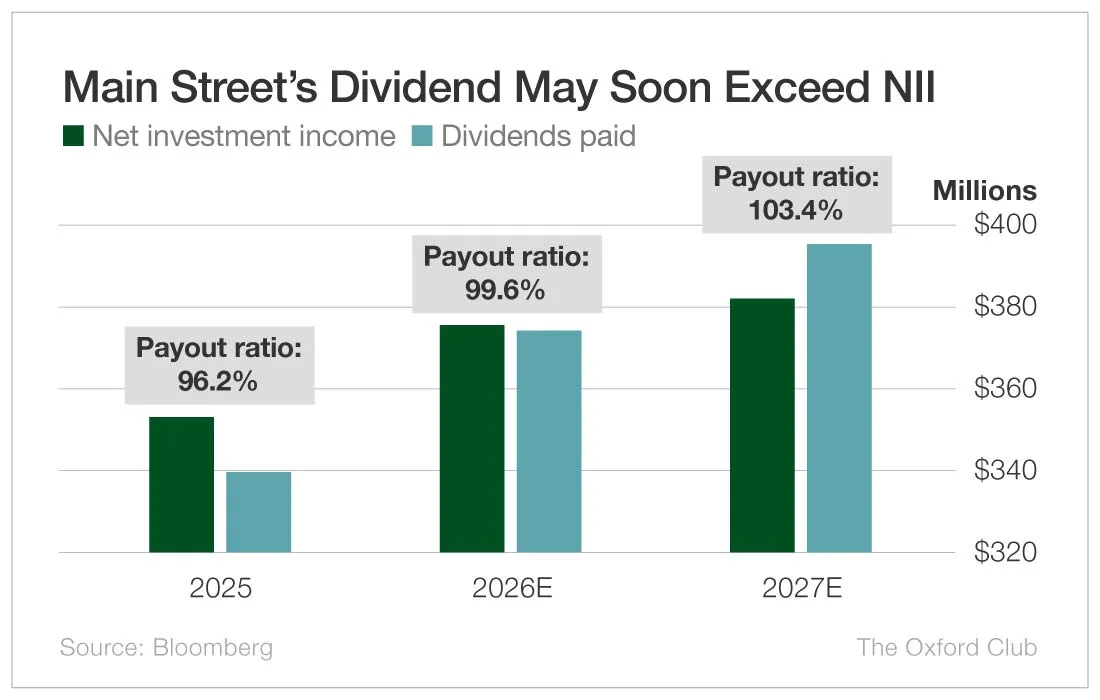
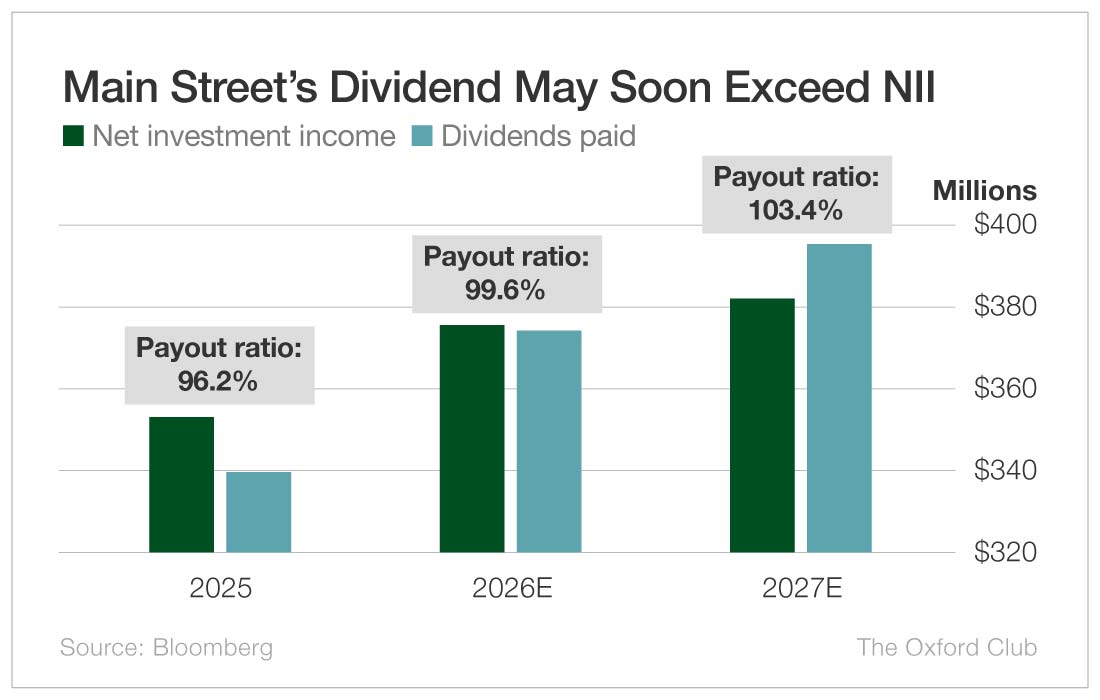
Main Street Capital’s dividend picture has two sides: its net investment income is rising, while its projected 2027 dividend payments are expected to exceed that income. That gap deserves attention for anyone assessing the company’s payout, especially because the headline yield includes a quarterly special dividend as well as the regular monthly payment.
Main Street Capital is a business development company, or BDC, that provides equity and debt financing to privately held companies. Its portfolio includes loans and ownership stakes across businesses in different industries. For example, it has a $5.3 million equity position dating to 2011 and a $2.2 million loan at 12% to N.R.P. Jones, an Indiana manufacturer serving oil, natural gas, agriculture, mining and other industries. Main Street also has a $5.4 million equity investment and a $21.5 million loan at 13% to Career Team Holdings, a workforce training software company. A $22.8 million loan at 14% to Slick Innovations, which provides a text-based marketing platform, is another holding.
Income is rising, but the margin is narrowing
Interest collected on loans and proceeds from equity investments contribute to investment income. After expenses, the figure used to assess a BDC’s dividend coverage is net investment income, or NII. It offers a useful comparison with the dividends paid, though it is not the same measure as company profits.
Main Street reported $352.7 million in NII for 2025, a 3.3% increase from $341.4 million in 2024. Forecasts cited in the source put NII at $375.4 million in 2026 and $381.9 million in 2027. That upward path supports the dividend picture: growing income gives a company more room to meet its payments. But the forecasts also need to be considered alongside expected dividends, since income growth alone doesn’t tell the whole story.
In 2025, Main Street paid $339.3 million in dividends, equal to 96.2% of NII. The payout ratio compares dividends with the income used to cover them. A lower ratio generally leaves more room for unexpected costs or a decline in income; a ratio above 100% means the measured income fell short of the dividend total.
The source’s assessment uses 100% as the upper limit for a comfortable payout ratio. By that measure, 2026 is projected to be close: the expected ratio is 99.6%. The 2027 estimate is more challenging. Main Street is expected to pay $395 million in dividends that year, an amount projected to exceed NII by 3.4%.
A shortfall on this measure means a company needs another source of cash to pay the full dividend. It may draw on cash it already holds or seek financing. Either way, relying on money beyond current NII can make the payout harder to sustain if the shortfall continues. Forecasts can change, so the 2027 estimate is a reason to keep watching coverage rather than proof that the dividend will be cut.
The yield depends on a special payment
Main Street pays a regular dividend monthly. Its current regular payment is $0.265 per share, which the source says works out to a 6% yield. The company also typically pays a special dividend each quarter, and the source reports that it has done so every quarter since the end of 2021. The special payment has been $0.30 per share since March 2024.
Including the special dividend brings the stated yield to 8.2%. That distinction matters when comparing the headline figure with the regular income an investor might expect: the special payment is an additional part of the total, while the regular dividend is the monthly amount. A past pattern of quarterly special payments doesn’t, by itself, establish that future special payments will stay at the same level.
The regular dividend has increased for 16 consecutive years, according to the source. That history is evidence of sustained increases, and the company’s rising NII adds support. Still, the projected payout ratio is already close to the cited 100% threshold in 2026 and is expected to pass it in 2027. Those figures make the regular payment and the special dividend worth examining separately.
What to watch in the next update
The earlier assessment described Main Street’s NII as rising, its payout ratio as appropriate and its record of dividend increases as strong. The company received an “A” dividend safety rating at that time. The current assessment retains an A rating, while recognizing that the expected 2027 payout above NII puts pressure on the coverage calculation.
The outlook rests on estimates, not settled results. Future NII, the amount paid in dividends and the special payment can all affect the ratio. A useful next check is whether reported NII continues to grow and whether total dividends track that growth. If dividends rise faster than NII, the coverage gap could widen; if income grows enough to keep pace, the forecast pressure may ease.
Main Street’s record of annual increases and rising NII are encouraging features, while the 2027 projection is a clear point of caution. The 8.2% yield also includes special payments, so it should not be read as the regular monthly dividend alone. For anyone following the company, the key figures to revisit are NII, total dividends and the payout ratio as fresh results become available.
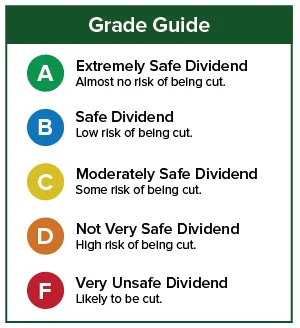
For readers comparing dividend assessments, the source notes that its Safety Net tool analyzes individual stocks, not exchange-traded funds, mutual funds or closed-end funds. It also links to a previous discussion of Main Street and an earlier review of its dividend safety. Those pieces provide background; the current figures point to the same practical takeaway: follow income and payouts together, and distinguish the regular dividend from the special one.
Read the original Main Street Capital analysis or visit the Wealthy Retirement homepage.